Think of sales funnel metrics as the vital signs for your entire sales process. They're the specific numbers you watch to see how well you're guiding people from just hearing about you all the way to becoming a paying customer. These metrics give you a clear, honest look at what’s working and, just as importantly, where you're losing people along the way.
Why Your Business Needs Sales Funnel Metrics
Ever tried to drive to a new place without GPS? You might eventually get there, but you’ll probably take a few wrong turns, waste a lot of gas, and get incredibly frustrated. Running a business without tracking sales funnel metrics is a lot like that—you're spending time and money on marketing and sales, but you're flying blind, with no idea if your efforts are paying off.
These metrics are what turn your daily business activities into something you can actually measure and improve. They’re the tools that let you stop guessing and start making smart, data-backed decisions. Without them, you're just hoping for the best, completely unaware of the leaks in your funnel that are quietly draining your budget.
From Vague Problems to Specific Solutions
So many businesses have a gut feeling that something is wrong. Maybe leads aren't turning into sales, or the ad budget feels like a black hole. But they can't put their finger on the exact problem. This is where tracking the right numbers brings incredible clarity.
Instead of saying, "Our sales feel slow," you can pinpoint the issue: "Our conversion rate from demo to trial dropped by 15% last quarter." That single piece of information tells you exactly where to focus your attention.
A sales funnel isn't just a marketing concept; it's the real-world path your customer takes with your brand. The metrics are your customers' way of telling you, step-by-step, what’s resonating and what’s frustrating them.
This data-first mindset helps you diagnose problems with surgical precision. For instance, if you have tons of website traffic but very few new leads, you know the problem isn't your ads. It's likely an issue on your landing pages or with your offer.
Turning Numbers into an Actionable Strategy
The real magic of sales funnel metrics is how they guide your strategy. Every data point tells a story and points toward a solution. To see how these numbers connect directly to revenue, it's helpful to explore top sales performance metrics examples and understand the broader picture.
Here’s how this looks in practice:
- High Cost Per Lead (CPL)? This is often a sign your ad targeting is too wide. The fix? Tighten up your audience criteria to reach people who are a much better fit.
- Low Lead-to-Customer Rate? Getting lots of leads that go nowhere usually points to a weak spot in your follow-up or nurturing. Maybe you're too slow to respond, or your email sequence isn't hitting the right notes.
- High Cart Abandonment Rate? This is a classic last-minute fumble. It’s a huge red flag that your checkout process might be too complicated, or you’re missing key payment options.
When you consistently watch these numbers, you stop reacting to problems and start anticipating them. You can put your budget where it will have the biggest impact and build a sales process that’s more efficient, predictable, and ultimately, more profitable.
Mapping Your Customer's Journey Through the Funnel
Before you can measure anything, you need a map. A sales funnel is exactly that—a map of the journey someone takes from the moment they first hear about you to when they finally click "buy." Without this map, your sales funnel metrics are just a jumble of numbers. They lack the story and context needed to understand what’s actually happening with your customers.
It's a lot like planning a road trip. You wouldn't just hop in the car and start driving aimlessly. You'd pull out a map to see the major cities (stages) you'll pass through along the way. Your sales funnel gives you that same high-level view, breaking down a complex customer journey into simple, understandable stages.
The Four Classic Stages of The Sales Funnel
While every business adds its own unique flavor, the customer's path usually follows a well-worn pattern. We call it a "funnel" because it's always wider at the top than the bottom—you’ll naturally attract far more people than you ultimately convert. The classic model breaks this journey down into four core stages.
Awareness: This is the very top of the funnel (ToFu). It’s that first "hello"—when a potential customer stumbles across your brand. Maybe they saw an ad, found one of your blog posts on Google, or heard your name mentioned on a podcast. They aren't ready to buy anything yet; they’re just becoming aware you exist and might have an answer to a problem they're facing.
Interest: Now that they know your name, a portion of those people will move into the middle of the funnel (MoFu). This is where passive awareness turns into active curiosity. They start digging a little deeper, maybe by reading a few more blog posts, downloading a free guide, or following you on social media to see what you're all about.
Consideration: Further down in the MoFu, a prospect shifts from general interest to serious evaluation. They're now actively comparing you to your competitors and weighing their options. This is when they might watch a product demo, read through your case studies, or sign up for a webinar to see your solution in action. Their behavior signals they're getting very close to making a choice.
Conversion: We've reached the bottom of the funnel (BoFu), where the final decision is made. The prospect takes that last step and becomes a paying customer. Whether it's completing a checkout, signing a contract, or starting a subscription, this is the moment all your hard work was leading up to.
This is where you can see how crucial those top-of-funnel metrics are for building a healthy pipeline.
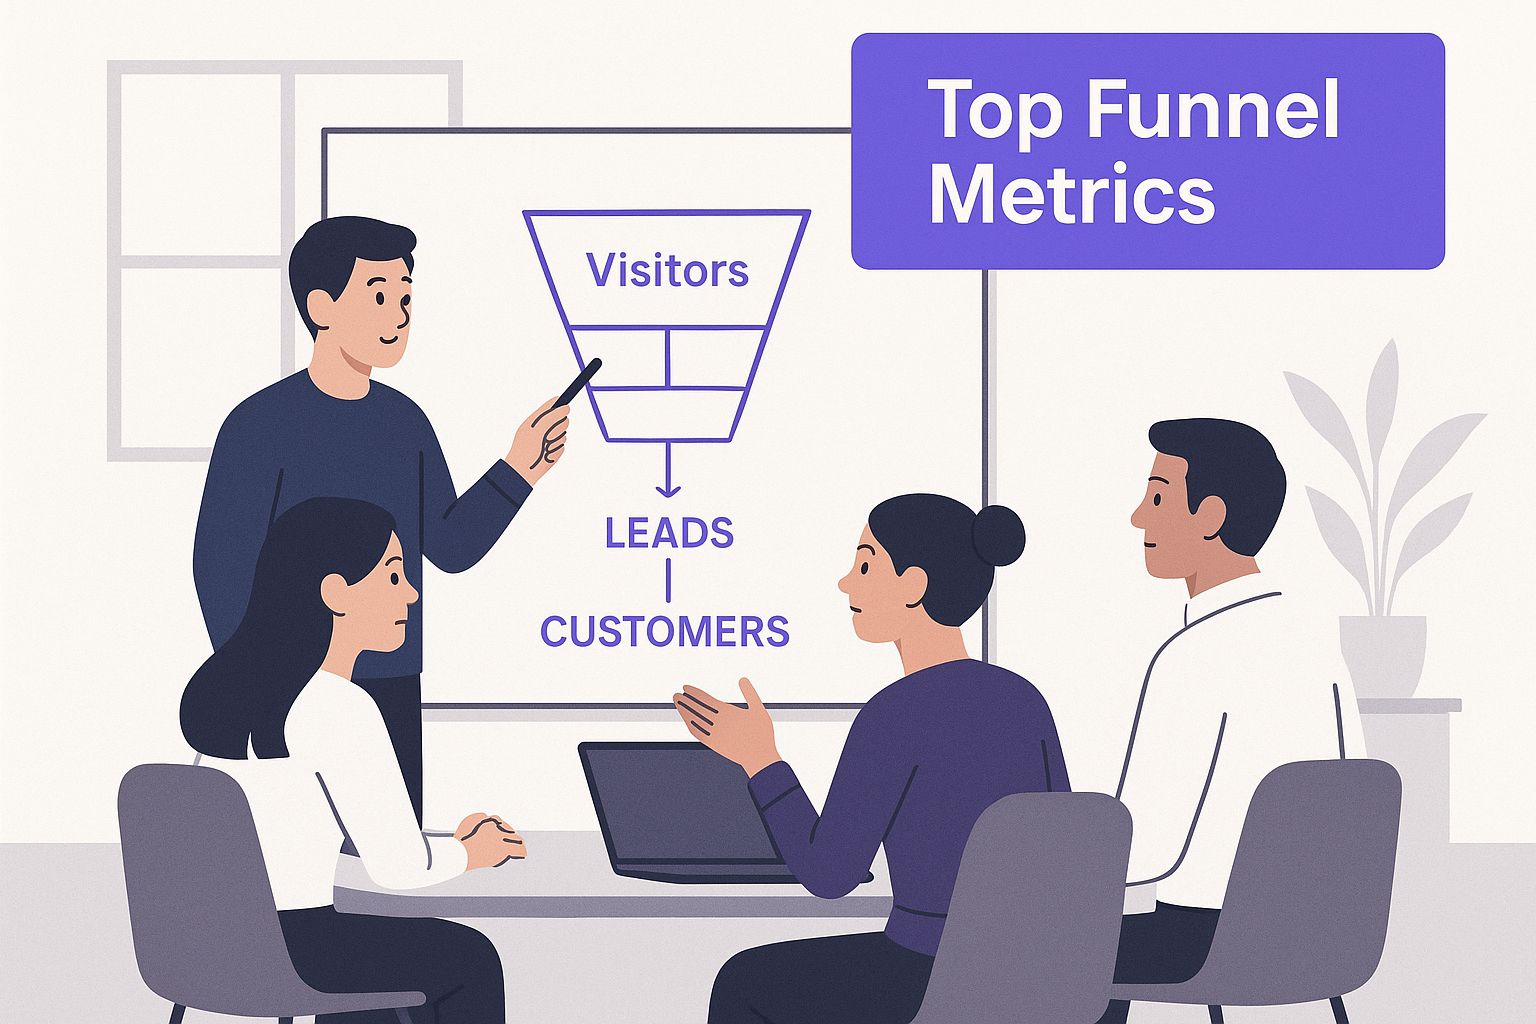
The image drives home a key point: without a steady stream of people entering at the Awareness stage, the rest of the funnel simply starves.
Connecting Metrics to Mindset
The real magic happens when you connect each stage to what your customer is actually thinking and feeling. Once you understand their mindset at each step, you can pick the right metrics to see how well you're meeting their needs.
For example, tracking "Conversion Rate" for someone in the Awareness stage is pointless—they barely know who you are. Instead, you'd look at metrics like "Reach" or "Website Traffic" to gauge how effectively you're grabbing that initial attention.
To tie it all together, here's how different goals and metrics align with each stage of the journey.
Key Metrics Across The Sales Funnel Stages
Awareness Stage
- Primary Goal: Attract new audiences and build brand visibility.
- Example Key Metric: Website Traffic / Impressions
Interest Stage
- Primary Goal: Engage prospects and capture their information.
- Example Key Metric: Lead Magnet Downloads / Email Sign-ups
Consideration Stage
- Primary Goal: Nurture leads and prove your solution is the best choice.
- Example Key Metric: Demo Requests / Webinar Attendance
Conversion Stage
- Primary Goal: Turn a prospect into a paying customer.
- Example Key Metric: Sales Conversion Rate / Customer Acquisition Cost
Seeing your metrics organized this way makes it much easier to spot where things are going right—and where they’re going wrong.
A well-structured funnel allows you to diagnose problems with precision. If you have high traffic (Awareness) but low lead generation (Interest), you know the issue isn't discovery; it's the bridge between those two stages.
This approach transforms a confusing dashboard of analytics into a powerful diagnostic tool. You can pinpoint exactly where people are dropping off or losing interest, which tells you precisely where to focus your efforts for the biggest impact. By mapping your sales funnel metrics to these distinct stages, you create a clear, actionable plan for growth.
Gauging Your Reach: Top-of-Funnel Metrics Explained
Your sales funnel kicks off the very first time someone stumbles upon your brand. This initial "hello" happens at the Top of the Funnel (ToFu), and its success all comes down to one thing: reach. Before you can even think about nurturing leads or closing deals, you have to get your message in front of the right eyeballs.
Think of Top-of-Funnel metrics like taking attendance at the start of a show. It tells you exactly how many people are in the audience, ready to listen. If you don't have a steady stream of new visitors coming in at this stage, the rest of your funnel will simply starve for opportunities. That makes this a crucial first step in understanding your overall performance.
Understanding Your Website Traffic
The most foundational ToFu metric is, without a doubt, Website Traffic. This number counts every single person who lands on your site, whether they got there from a Google search, a social media post, or a paid ad. It’s the digital version of foot traffic in a physical store.
But just looking at the total visitor count only gives you part of the picture. To get real insight, you have to dig deeper and figure out where that traffic is coming from. This is where a tool like Google Analytics becomes indispensable, as it neatly breaks down your traffic into different channels.
- Organic Traffic: These are the visitors who find you through unpaid search results. A high volume of organic traffic is a fantastic sign that your SEO and content strategies are hitting the mark.
- Paid Traffic: This is anyone who clicks on one of your ads, whether on Google, Facebook, or another platform. This traffic is quick to acquire but comes with a direct cost.
- Direct Traffic: These are the folks who type your website address directly into their browser. It’s a strong indicator of brand recognition and recall.
- Referral Traffic: These visitors arrive by clicking a link on another website. This is a powerful signal of your brand's authority and a great source of qualified visitors.
Knowing where your visitors come from is the first step in diagnosing the health of your brand awareness efforts. For example, a sudden drop in organic traffic could signal a ranking issue that needs your immediate attention.
Reach and New Visitor Rate
While traffic counts the number of visits, Reach measures the number of unique people who see your content. It’s a subtle but important difference. If one person visits your site five times, that’s five traffic sessions but only one person in your reach. This metric is especially critical for ad campaigns, where you want to know how many distinct individuals saw your ad, not just how many times it was shown.
A closely related metric is the New Visitor Rate, which shows you the percentage of your traffic from people who have never been to your site before. A high New Visitor Rate means your awareness campaigns are working and drawing in a fresh audience—which is the whole point of the top of the funnel. If you're looking to boost these numbers, our guide on proven lead generation strategies offers some great ideas.
High traffic numbers can be deceiving if they aren't paired with a healthy New Visitor Rate. If all your traffic comes from the same group of existing customers, your funnel isn't growing. You're just talking to the same people over and over again.
This distinction is crucial. You absolutely need both new and returning visitors for a healthy business, but at the ToFu stage, the primary focus should always be on expansion and discovery.
Interpreting Early Engagement Signals
Getting people to your site is only the first part of the puzzle. You also need to know if they stick around and find what they were looking for. This is where early engagement sales funnel metrics come into play.
A high Bounce Rate—the percentage of visitors who leave after viewing just one page—can be a huge red flag. It’s like having a flashy storefront that leads to an empty or confusing shop. High traffic combined with a high bounce rate often means there's a disconnect between your marketing message and your landing page experience. This is a problem you have to fix quickly before it wastes your ad spend and damages your reputation.
Gauging Engagement with Middle of Funnel Metrics
Okay, so you’ve captured someone's attention at the top of the funnel. Now what? This is where the real work begins. The goal shifts from simply being seen to creating genuine engagement. We've entered the critical Middle of the Funnel (MoFu), the stage that separates the window shoppers from your true potential customers.
MoFu metrics are all about tracking active interest. They measure the specific actions people take that show they're moving past casual curiosity and are starting to seriously consider what you have to offer. These actions are the first concrete proof that your message is hitting the mark with the right crowd.
From Passive Viewers to Active Leads
At this stage, the most fundamental metric to watch is your Lead Generation Rate. This is simply the percentage of your website visitors who take a specific action—like filling out a form or signing up for a newsletter—to become a lead. A healthy lead generation rate tells you that your initial hook worked and your offer is valuable enough for someone to hand over their contact details.
These actions usually revolve around high-value content, often called a "lead magnet." Keeping a close eye on how these perform is essential.
- Content Downloads: This tracks how many people download gated resources like your whitepapers, eBooks, or case studies. If a particular asset is getting a lot of downloads, you’ve likely hit on a major pain point for your audience.
- Webinar Registrations: This is a fantastic indicator of high intent. Someone willing to block off 30-60 minutes of their day to hear you speak is far more invested than someone who just skims a blog post.
- Email Subscriptions: When a user subscribes to your newsletter, they're inviting you into their inbox. It’s a direct invitation to build a relationship and keep the conversation going.
Tracking these numbers helps you figure out which offers are actually turning anonymous visitors into known leads. If you want to dive deeper, learning about lead generation for SaaS companies can help you build systems that consistently convert.
Are Your Calls to Action Doing Their Job?
A huge part of improving your middle-funnel numbers comes down to your Call to Action (CTA). This is the button or link you use to prompt a user to take that next step. A weak or confusing CTA can bring your entire funnel to a screeching halt.
Think of your CTA as a signpost on a highway. If the sign is hard to read or points in the wrong direction, drivers get confused and exit. Your CTA needs to be crystal clear, compelling, and perfectly aligned with the value you're offering. For example, a button that says "Get My Free Marketing Plan" is infinitely more specific and enticing than a generic "Submit."
Your Middle of Funnel is where you start building trust at scale. Every download, subscription, and registration is a small 'yes' from a prospect, a micro-commitment that signals they are ready to learn more and invest their time in your brand.
This stage is all about proving your expertise and delivering value before you even think about asking for the sale. A well-oiled MoFu nurtures prospects, answers their biggest questions, and builds the confidence they need to move toward making a purchase.
Identifying Your Best Prospects with Lead Scoring
As you start generating more leads, you’ll quickly face a new problem: not all leads are created equal. Some are primed for a sales call right now, while others need more time and nurturing. This is where Lead Scoring becomes one of the most powerful sales funnel metrics in your toolbox.
Lead scoring is a system for assigning points to leads based on who they are and what they do. For instance, you might give 10 points to a lead from a target industry, and another 20 points to anyone who downloads your pricing guide.
Once a lead hits a predetermined point threshold, they’re automatically flagged as a Marketing Qualified Lead (MQL) and handed off to the sales team. This simple but effective system ensures your reps focus their precious time on the hottest, most engaged prospects, which dramatically improves their efficiency and close rates.
Driving Revenue with Bottom of Funnel Metrics
https://www.youtube.com/embed/kLneJKAqRtk
You've made it to the bottom of the funnel (BoFu). This is where the magic is supposed to happen—where all your hard work guiding prospects through the awareness and consideration stages finally pays off. This is where browsers become buyers, and interested leads turn into paying customers.
The sales funnel metrics you track here are the ones that connect directly to your company's revenue and profitability. Because of that, a leak at this stage is more expensive than anywhere else. After all, the last thing you want is for a qualified, interested prospect to stumble right at the finish line. BoFu metrics show you exactly how well you’re closing deals and turning that hard-earned interest into cold, hard cash.
The Ultimate Metric: Conversion Rate
At the bottom of the funnel, one metric rules them all: your Conversion Rate. This is simply the percentage of prospects who take that final, crucial action—making a purchase, signing a contract, or starting a subscription. It’s the clearest, most direct measure of your sales team's effectiveness.
Figuring it out is pretty straightforward:
Conversion Rate = (Total Number of Sales / Total Number of Leads) x 100
So, if you generated 500 qualified leads last month and managed to close 25 of them, your conversion rate is 5%. While the formula is simple, that single number tells a powerful story about your product, your pricing, and your entire sales process.
So, Is Your Conversion Rate Any Good?
Knowing your conversion rate is one thing; knowing if it's "good" is a completely different ballgame. The truth is, conversion rates are all over the map. They swing wildly depending on the industry, the price of the product, and the sales model. A low-cost e-commerce store might see conversion rates of 3-4%, while a company selling high-ticket B2B software could be wildly profitable with a rate under 1%.
The real key is to establish your own internal benchmark and then focus relentlessly on improving it, month after month.
E-commerce is one of the most closely watched sectors for funnel performance, and the numbers show just how tough it is to get visitors to click "buy." For example, in 2022, the mobile e-commerce conversion rate hovered around a mere 2%, even though mobile devices drove 68% of all e-commerce traffic. That gap reveals a massive opportunity. Learn more about the data behind sales funnel optimization.
At the bottom of the funnel, even tiny improvements can have a massive impact on your bottom line. Bumping your conversion rate from 2% to 3% might not sound like much, but it’s a 50% increase in revenue from the exact same pool of leads.
This is precisely why optimizing the final steps of the customer journey delivers such a high return.
Tackling the Notorious Cart Abandonment Rate
For any e-commerce business, one of the most frustrating BoFu metrics is the Cart Abandonment Rate. This tracks the percentage of shoppers who add items to their cart but vanish before completing the purchase. On average, this rate is a staggering 70%. Think about that—it represents a huge pile of almost-revenue walking right out the door.
The reasons are endless, from unexpected shipping costs popping up at the last second to a checkout process that’s just too clunky. Your job is to hunt down that friction and eliminate it.
Here are a few proven ways to fight back against cart abandonment:
- Exit-Intent Popups: Just as a user’s cursor drifts toward the back button, hit them with a popup offering a last-minute deal, like 10% off or free shipping. It's often the perfect nudge to get them over the finish line.
- Abandoned Cart Emails: If you’ve captured their email address, an automated recovery sequence is a must. The first email should be a gentle reminder, sent within an hour. Follow-up emails can then introduce a little urgency or a small incentive to sweeten the deal.
- Streamline the Checkout: Make paying you as easy as possible. Cut out unnecessary form fields, let people check out as a guest, and prominently display trust badges, security seals, and customer reviews.
Plugging these leaks is one of the fastest ways to boost your sales without spending a single extra dollar on traffic. To take it a step further, analyze all your revenue channels, including how you are managing affiliate programs, to make sure every path to purchase is optimized. It’s these small, targeted fixes at the final stage that separate the good funnels from the great ones.
Building Loyalty with Post-Purchase Metrics
It’s easy to think a sale is the finish line. But in reality, the moment a customer clicks "buy" is the starting gun for the next race. The journey doesn’t end with that first transaction. For the smartest businesses, this is where a new, more valuable phase begins—one focused on turning a one-time buyer into a loyal, long-term advocate for your brand.
This is where post-purchase sales funnel metrics come in. They shift your focus from simply acquiring new customers to retaining the ones you already have. These numbers give you a brutally honest look at the health of your business, telling you whether you're building a sustainable community or just spinning your wheels on a constant treadmill of one-off sales.
Measuring the True Value of a Customer
So, how do you measure what a customer is really worth beyond their first purchase? Two of the most important metrics you'll want to get familiar with are Customer Lifetime Value (CLV) and Average Order Value (AOV).
CLV is a powerhouse. It forecasts the total revenue you can reasonably expect from a single customer throughout their entire relationship with your business. Knowing this number is a game-changer because it tells you exactly how much you can afford to spend to attract—and keep—the right kind of customers.
Calculating these metrics is more straightforward than you might think.
Average Order Value (AOV): This tells you, on average, how much customers spend each time they buy from you. The formula is simply: Total Revenue / Number of Orders. If your AOV is climbing, it's a great sign your upselling and cross-selling efforts are hitting the mark.
Customer Lifetime Value (CLV): This projects the total profit you'll earn from a customer over time. A simple way to calculate it is: (Average Purchase Value x Average Purchase Frequency) x Average Customer Lifespan. Grasping your CLV helps you justify investing more to acquire high-value customers who will stick around for the long haul.
Think of AOV and CLV as two sides of the same coin; together, they give you a clear picture of your company's financial stability and growth potential.
Your best customers aren't the ones who make the biggest first purchase, but the ones who come back again and again. Post-purchase metrics help you identify and nurture these valuable relationships, turning happy customers into your most powerful growth engine.
This is the fundamental shift from just making sales to building relationships.
Keeping Your Customers Coming Back
Here's a statistic that should get your attention: acquiring a new customer can cost five times more than keeping an existing one. That’s why your Customer Retention Rate is one of the most critical metrics for sustainable growth. It simply measures the percentage of customers who stick with you over a given period.
A high retention rate is proof that you're delivering on your promises. It means your customers are happy with your product, they enjoy the experience you provide, and they see a reason to stay loyal. Building these connections is crucial, whether you're following up after a purchase or turning event connections into long-term relationships. By focusing on great support, post-purchase follow-ups, and genuine loyalty programs, you can boost this number and build a business that truly lasts.
Your Top Questions About Sales Funnel Metrics, Answered
Alright, even with a solid grasp of what to track, the real questions pop up when you start digging into the data. Let's tackle some of the most common hurdles people face, so you can start interpreting your sales funnel metrics like a pro.
How Often Should I Check My Metrics?
The honest answer? It depends on what you're looking at.
Think of it like checking on a car. You might glance at your speed (daily metrics) constantly, but you're not checking the engine oil (strategic metrics) every five minutes.
For top-of-funnel numbers like Website Traffic or Click-Through Rates, checking in daily or weekly makes sense. These are fast-moving metrics, and a quick look can help you spot a problem or an opportunity with an ad campaign right away.
For anything further down the funnel, a weekly review is usually a good rhythm for making smart, tactical adjustments. But for the big-picture stuff like Customer Lifetime Value (CLV) or Customer Retention Rate, give it more time. A monthly or even quarterly review is best, as you’re looking for meaningful, long-term trends, not just daily noise.
What’s a “Good” Conversion Rate?
This is the million-dollar question, isn't it? The truth is, there's no single magic number. Conversion rates are all over the map depending on your industry, price point, and even where your traffic is coming from.
For instance, a typical e-commerce store might celebrate a 2-3% conversion rate. Meanwhile, a SaaS business could see 3-5% on their free trial sign-ups and be right on track. The numbers are just too different to compare directly.
Instead of chasing some generic industry average, your real job is to establish your own baseline. The goal isn't to hit an arbitrary number you read in a blog post; it's to consistently improve on your numbers, month after month. That's what real growth looks like.
What Tools Do I Actually Need for Tracking?
You can breathe a sigh of relief—you don’t need a ridiculously expensive suite of software to get started. A couple of core tools will give you a surprisingly clear picture of your entire customer journey.
For the Top of Your Funnel (ToFu): Your best friend here is a solid web analytics platform. A lot of questions come up on how to actually use these tools in practice, so if you want a guide, you can learn how to use Google Analytics effectively. It’s perfect for keeping an eye on traffic, bounce rates, and where new visitors are coming from.
For the Middle & Bottom of Your Funnel (MoFu/BoFu): This is where your CRM—think HubSpot or Salesforce—becomes mission-critical. It’s what you'll use to track leads as they mature from a curious prospect to a closed deal. If you're in e-commerce, your platform like Shopify is your source of truth for cart abandonment and actual sales.
When you use these tools together, you can finally connect the dots. You’ll see the full story, from the very first ad a customer clicks all the way to them becoming a loyal, repeat buyer. That’s how you get a complete picture of your funnel’s health.
Ready to turn your presentations into a powerful lead generation engine? SpeakerStacks gives you the tools to capture audience attention and convert it into measurable ROI. Create a branded landing page in seconds, share it with a simple QR code, and watch the leads, meetings, and data roll in. Start turning your speaking events into performance with SpeakerStacks.
Want More Insights?
Subscribe to get proven lead generation strategies delivered to your inbox.
Subscribe to Newsletter

